
Seven Reasons Your Organization Needs a Google Data Studio Dashboard
If your organization cares about promoting itself online in any way, you need a Google Data Studio Dashboard. It makes all of your digital data easy to see, understand, and respond to. And most importantly, it quickly shows you when a particular effort isn’t working—saving you money and time in the process.
Access to data isn’t your problem; you probably have performance data coming out of your ears. Your challenge is surfacing data in a way that makes sense. Make no mistake, when it comes to acting on analytics, presentation matters. Google Data Studio will give you a dashboard that is:
Accessible
Instead of wading through a handful of individual reports generated on multiple platforms, a custom dashboard can help you access multiple reports in one place.
Relevant
Default dashboards like the Google Analytics’ homepage often deliver reports that don’t matter to your organization. Google Data Studio allows you to use dashboards that present the most relevant information.
Professional
Google Data Studios just looks better. It’s ideal for presenting to your internal teams and board. Google Data Studio (GDS) is our clear favorite among the many marketing dashboards we’ve reviewed.
Here are seven reasons why you should create a GDS dashboard for your organization.
1. Free
It doesn’t cost you anything to create a GDS dashboard!
2. Branded Design
Other platforms allow you to rearrange the location of reports in your dashboard, but GDS allows you to customize the size and location of reports on a grid. View your reports on one or multiple pages. The visuals and fonts can be updated to match your branding.
3. Customizable Reports
Add the fields you want and exclude fields that aren’t relevant. For example, GDS allows you to include multiple dimensions—like “Page” and “Page Title”—and multiple metrics—like “Sessions” and “Goal Completions” for multiple goals.
You can also create calculated fields—from simple math calculations and percentages to date comparisons (e.g., number of days from Jan 5 - Apr 8) and if/then logic (e.b., If country = “Germany” then “Europe”).
4. Interactive
Your GDS dashboard will allow you to interact with your reports in ways that are not possible with performance reports in PDF, including:
- Change date ranges and compare to previous periods.
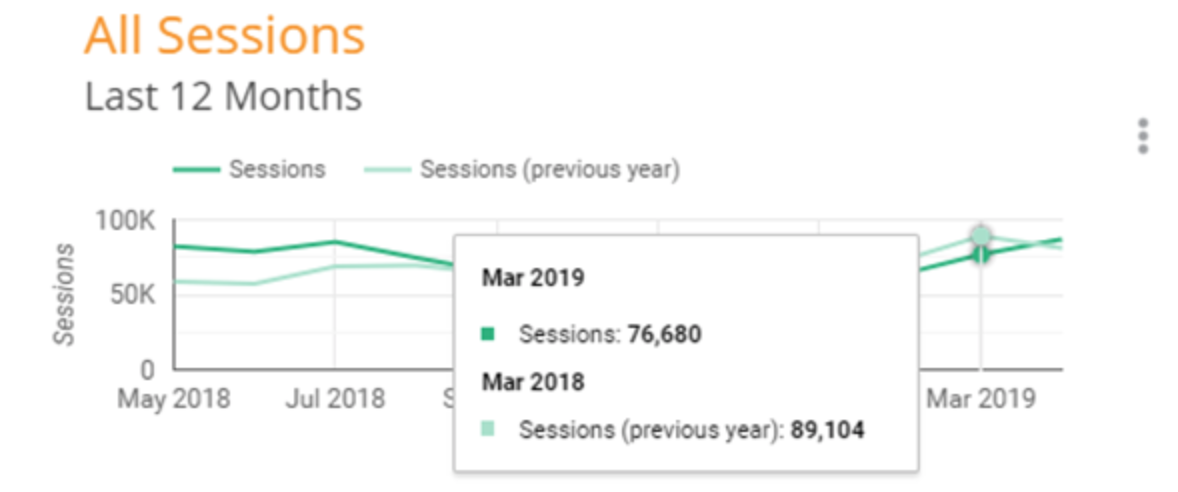
- Hover over graphs to see metrics.
- Sort table columns to see data for different metrics.
- Scroll down on tables with multiple rows.
Thoughts on strategy delivered to your inbox.
5. Connect to Multiple Data Sources
GDS has created connectors that allow you access to a number of data sources like Google Analytics and Google Ads. You can also connect to a Google Sheet if you have internal reports that update periodically.
Partners like Supermetrics and Power My Analytics have created other connectors for access to dozens of additional platforms like Facebook Insights, Facebook Ads, Mailchimp, Constant Contact, and more. Supermetrics allows you to access a limited number of connectors for free with their “Hobby” plan, and charge more for super helpful connectors like “Ad Data + Google Analytics,” which shows the comparative performance of multiple ad campaigns on different networks in one table.
6. Updates Automatically
Set your GDS dashboard to update all reports automatically so you can always see the data for this week, last week, this month, last month, etc.
7. Shared Easily
Give specific users the ability to view or edit your dashboard, or let anyone with access to the GDS dashboard link view or edit.
Feel free to reach out to us for help if you get stuck, as GDS can be a bit complicated for those relatively unfamiliar with platforms like Google Analytics.
