
How to Set Up Destination Goals in Google Analytics
Note: On July 1, 2023, Universal Analytics will sunset and move entirely to Google Analytics 4. GA4 uses a completely different data model (event- vs. session-based) and UX platform to create custom goals and events, making the information in this article less relevant. Keep an eye on our Insights for upcoming articles and tools to help you make the transition, and proceed here with caution knowing that you’ll need to familiarize yourself with this new platform coming down the line.
If you’re doing anything to bring more traffic to your website, it is important to track how these users are engaging. Google Analytics tells you a lot about these users, including how traffic has increased, how long they’ve stayed on your site, and the pages they’ve visited.
Gaining more traffic doesn’t automatically mean that users are doing what you want them to do, so it’s important to set up goals in Google Analytics.
In Google Analytics, a goal completion is registered every time a user completes any of the following:
- Duration: a user stays on your site for a minimum amount of time (i.e. at least 4 minutes).
- Pages/Screens per session: a user visits a minimum number of pages (i.e. at least 4 pages).
- Event: a user conducts a specific action on a website page (i.e. downloads a PDF or watches a video).
These three goals help you understand how people are engaging with the content on your site, but they’re not as great at helping you determine how your marketing efforts are influencing leads and sales. That’s where Destination goals come in.
Thoughts on marketing delivered to your inbox
About Destination Goals
Consider using Destination goals to track when visits result in any of the following:
- Form completion
- Online purchase
- Event registration
- Trial signup
- Signing up to receive newsletter or blog posts
- Clickthrough to a map page (for local companies wanting to get people to their store)
Google Analytics registers a Destination goal completion every time a user reaches a destination page, which is usually a thank-you page after completing a form. Here are some important things to consider about using Destination goals with forms and thank-you pages:
- Your form must direct to a separate thank-you page after completion. Destination goals will not work if a ‘thank you’ message pops up and the form page URL stays the same.
- If your website directs users to a third-party site to complete forms, your Google Analytics tracking code must be on every page with the form and thank-you page. This issue is common with e-commerce, membership, event, volunteer, and donation platforms, and marketing automation platforms that host the landing pages with the forms.
- Create unique thank-you pages when you want to track different types of form completions. Consider including helpful information on these thank-you pages to help users reengage with your content.
Setting Up a Destination Goal
Here is the step-by-step process for setting up destination goals in Google Analytics:
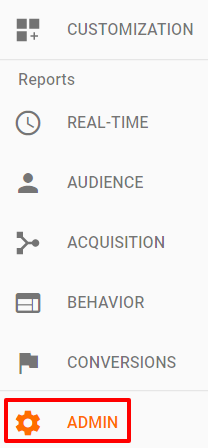
1. Select ‘Admin’ at the bottom of the left navigation
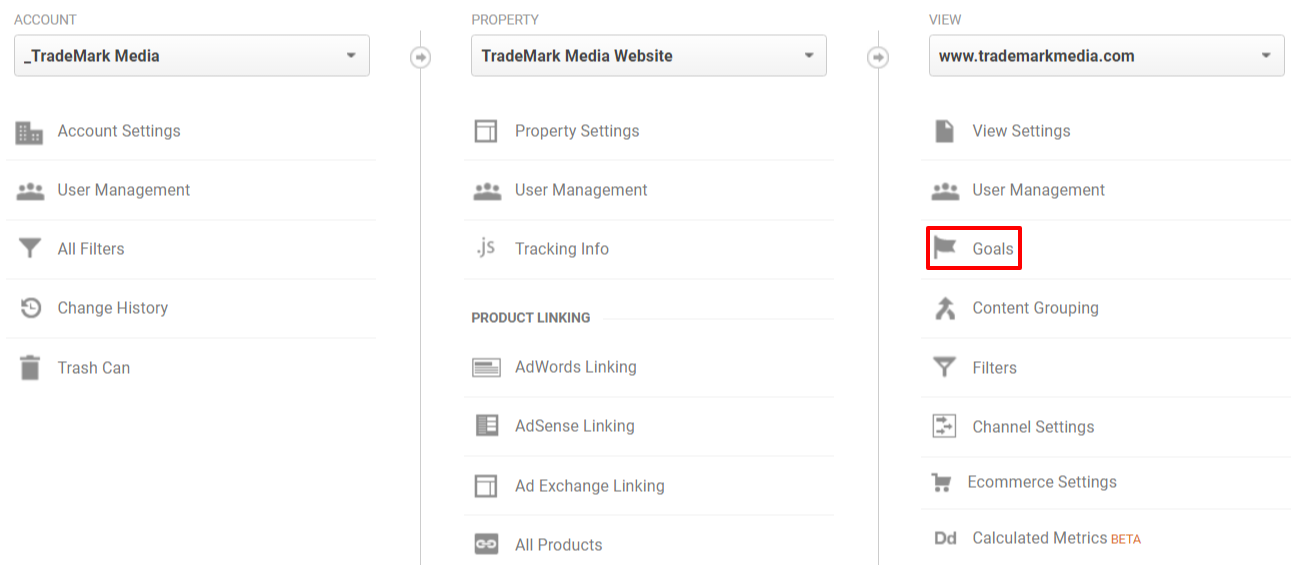
2. Select ‘Goals’ in the View column
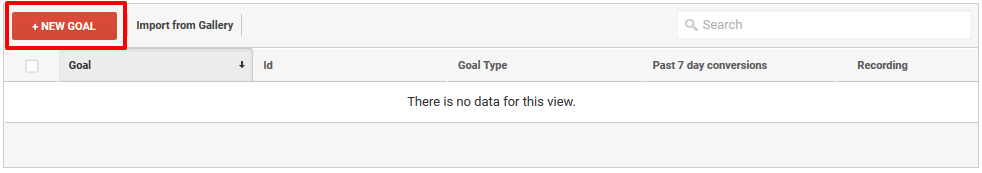
3. Select ‘New Goal’
4. Select ‘Custom’ at the bottom of the page and click ‘Continue’
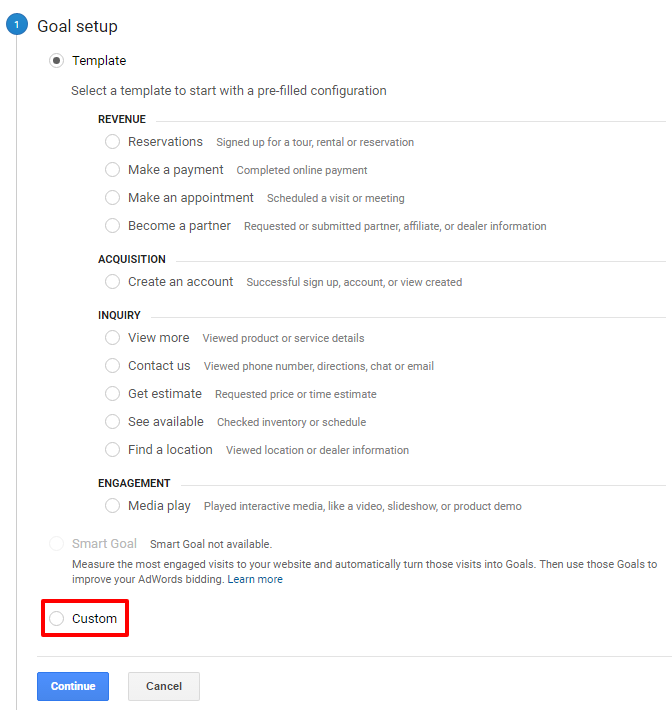
5. Name the goal with descriptive language, like ‘Contact Us Form’ (not ‘Goal 1’)
6. Select ‘Destination’ and click ‘Continue’
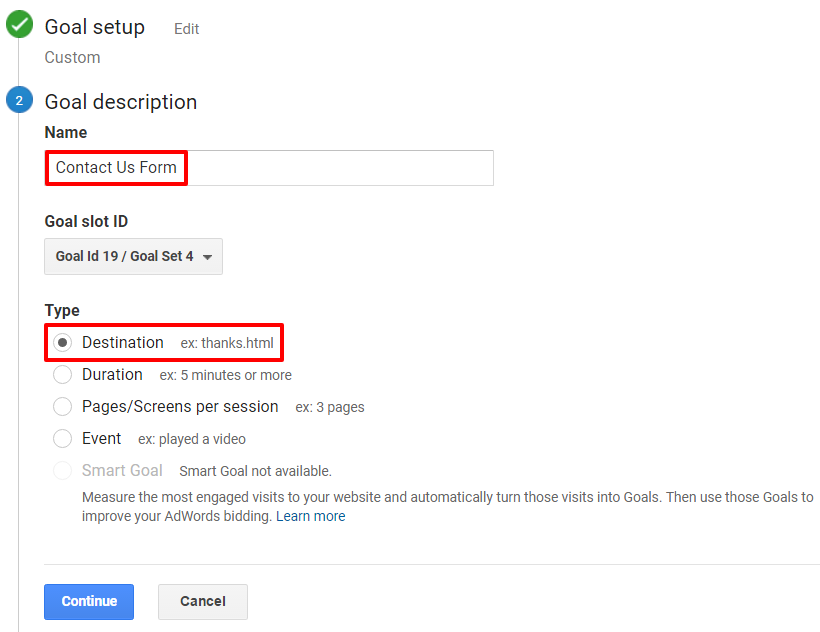
7. Destination
In the ‘Destination’ field, include the URL ending of the thank-you page, not including the base website domain (/form/thank-you).
In the Destination drop-down, select ‘Equals to’ if this is the exact URL where users will land. If your thank-you pages automatically generate additional text at the end of the URL (like /thank-you?12345…) select ‘Begins with’ in the dropdown.
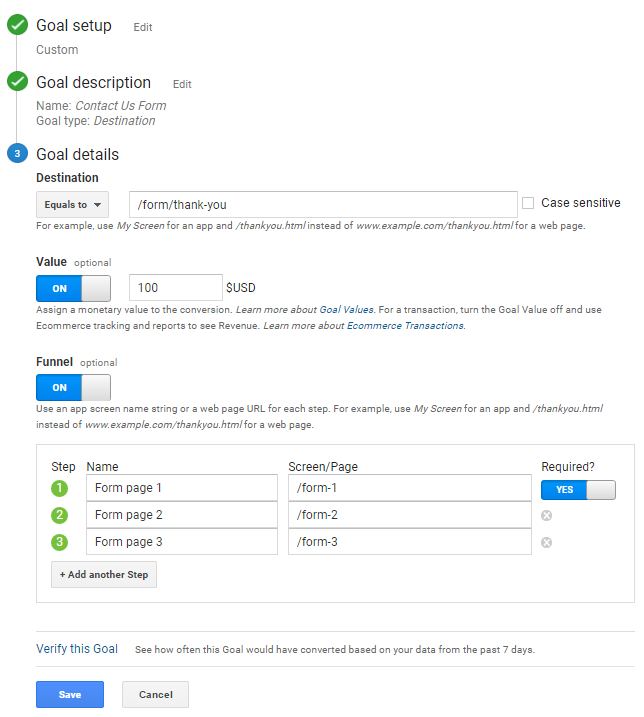
7a. Value (optional)
It is often difficult to assign a specific dollar value for a goal completion, but it is possible to determine that value by looking at historical data to see the average profit or revenue generated by one online lead if (for example) one out of every 30 leads becomes a paying client. If you want to track this, set Value to the ‘On’ position and enter the relevant value.
7b. Funnel (optional)
If your form resides on a specific page, it’s important that this page is listed as a step in a funnel. Set Funnel to the ‘On’ position, include a name for the form page, and include the URL ending for the page. If you only want to track those people who land on this form page before completing the form, set Required to ‘Yes.’ Don’t use this option if the form is on the home page or if you are tracking how 20 different pages with the same form end up on the same thank-you page.
If the user must advance through multiple pages to complete the form, it’s recommended that every page is included in the funnel in Step 2, Step 3, etc.
7c. Verify this Goal
If the form and Google Analytics code have been in place for at least 7 days, and you know that the form has been completed during this time, the conversion rate should be greater than 0 when you click ‘Verify this Goal.’
If not, there may be something wrong with the way the goal has been set up.
7d. When everything is correct, click ‘Save.’
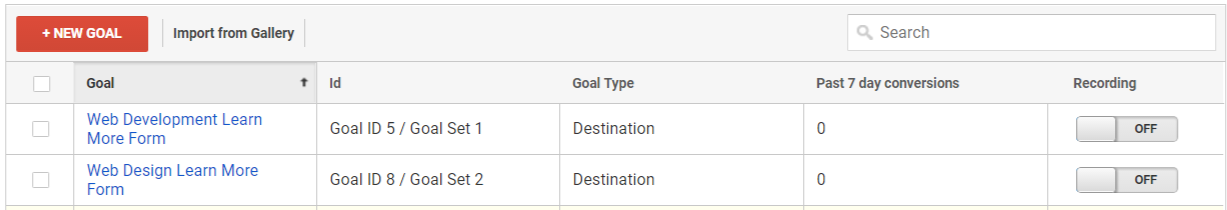
8. When the goal has been saved, it can be found on the Goals page (Admin > Goals).
It's important that you are only tracking the goals that matter to you, so set Recording to the ‘Off’ position for any goals that are no longer relevant.
Viewing Destination Goal Performance
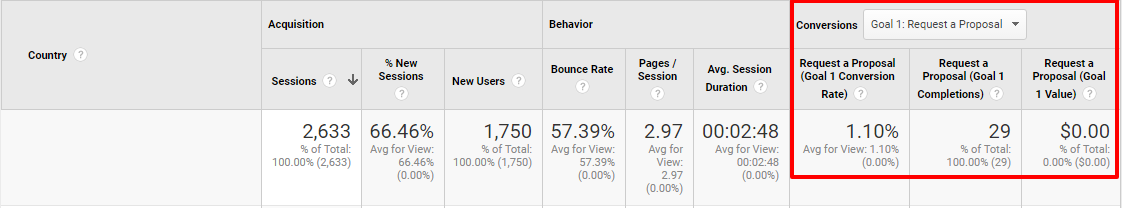
Many standard reports in Google Analytics allow you to view goal conversion performance. As you can see below, the rate of conversion, the total number of completions, and the value of that goal will be visible, and you can select all goals or specific goals in the dropdown.
Here are a number of standard reports that provide Conversion data:
- Location (Audience > Geo > Location): view by continent, sub continent, country, state, metro area, or city
- Mobile Overview (Audience > Mobile > Overview): view by desktop, mobile, or tablet.
- Channels (Acquisition > All Traffic > Channels): view by organic search, direct traffic, social networks, etc.
- Landing Pages (Behavior > Site Content > Landing Pages): view by the top performing pages users land on from offisite
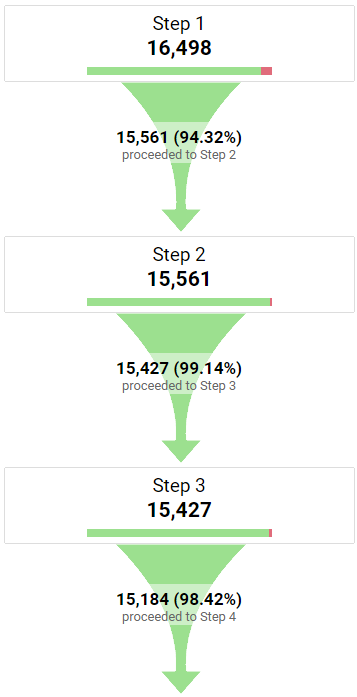
You can also see how users progress or abandon your funnels in the Funnel Visualization report (Conversions > Goals > Funnel Visualization). This report helps you determine any pages in your funnel that need better user experience to prevent abandonment.
Keeping it Simple
Here are three final thoughts about best practices for creating goals.
- Don’t create 15 different goals on your site if you can condense down to 3 or 4.
- Only create goals that align with real company value. For example, if you make your Services page a destination goal, this could account for 90% of your total goal conversions, which doesn’t effectively communicate the success of your most valuable goals.
- Continue to monitor and optimize your forms and pages to better capture your target audience!
Need some help with your organization’s Google Analytics? Feel free to reach out and let us know how we can be a partner.
